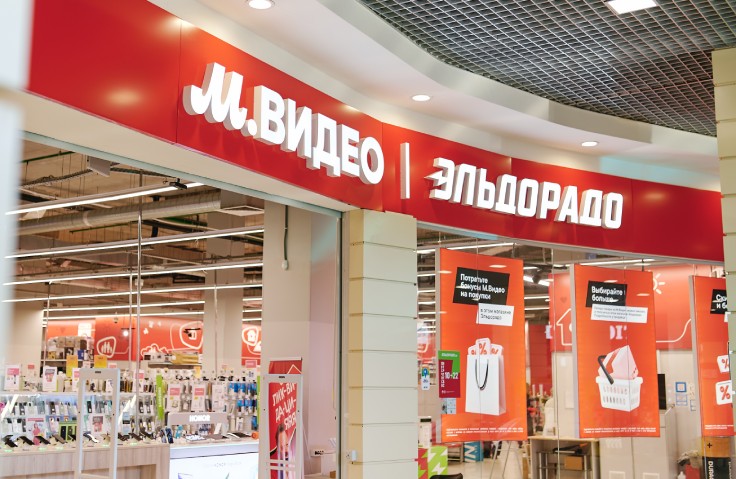
OJSC “Company “M.video” (“M.video” or the “Group”), one of the Russia's leading consumer electronics retailers (RTS, MICEX: MVID) announces today its consolidated audited financial statements prepared in accordance with International Financial Reporting Standards (IFRS) for the full year ended 31 December 2007.
The Group’s net revenue increased to Russian roubles (RuR) 52,317 million from RuR 36,258 million in 2006, demonstrating a 44% growth. Retail revenue (the sale of goods and services including internet sales) increased by 54% up to RuR 48,410 million. Growth in revenues was driven by the Group’s expansion and healthy double-digit like-for-like sales growth.
M.video gross profit increased 58% reaching RuR 12,364 million. The Group’s gross margin improved to 23.6% compared to 21.6%(1) in 2006. Improvement of the gross margin was achieved from increased scale of operations and growth in sales of high margin products and services.
The Group’s operating profit reached RuR 2,012 million increasing 75% from RuR 1,147 million in 2006, operating profit margin improved to 3.8% in 2007 from 3.2% in 2006. EBITDA increased 75% and reached RuR 2,536 million with the EBITDA margin increasing to 4.8% in 2007 from 4.0% in 2006.
M.video net profit for 2007 grew to RuR 649 million demonstrating 63% increase as compared to 2006.
Alexander Tynkovan, President and CEO of M.video commented on FY 2007 financial statements: “It was an exceptional year for our operations. We proved our ability to deliver on rapid growth of our chain whilst providing significant increase in revenues and strong margin performance. These results build a solid foundation for the successful implementation of our strategy for 2008 and beyond. We will continue our growth in the future while also concentrating on improving operational efficiency and maximizing the efficiency of our distribution and logistic platform”.
| 2007 | 2006 | y-o-y, % | |
| Net revenue, RuR million, incl. | 52 317 | 36 258 | 44% |
| Retail revenue, RuR million | 48 410 | 31 417 | 54% |
| Gross profit, RuR million | 12 364 | 7 825 | 58% |
| Gross margin, % | 23,6 | 21,6 | |
| Operating expenses(2), RuR million | 10 352 | 6 678 | 55% |
| As % of net revenue | 19,8 | 18,4 | |
| Operating profit (EBIT), RuR million | 2 012 | 1 147 | 75% |
| EBIT margin, % | 3,8 | 3,2 | |
| EBITDA, RuR million | 2 536 | 1 446 | 75% |
| EBITDA margin, % | 4,8 | 4 | |
| Net profit, RuR million | 649 | 398 | 63% |
(1) The number represents an adjusted gross margin for 2006 as soon as some advertising revenue showed as “other income” in 2006 has been reclassified to gross margin to be consistent with 2007 presentation.
(2) The operating expenses include selling, general and administrative expenses (SGA), other operating income and other operating expenses.

